Orders chart
Weekly and monthly orders & sales charts — what each chart shows, controls and how to interpret them.
This page documents the Orders charts available in Remarkable Commerce Manager. It describes the weekly and monthly orders and sales charts, the axes and filters, and how to read the visuals. There is no CSV/table download option on this page — it is a visual overview only.
At a glance
- Four primary visuals on this page:
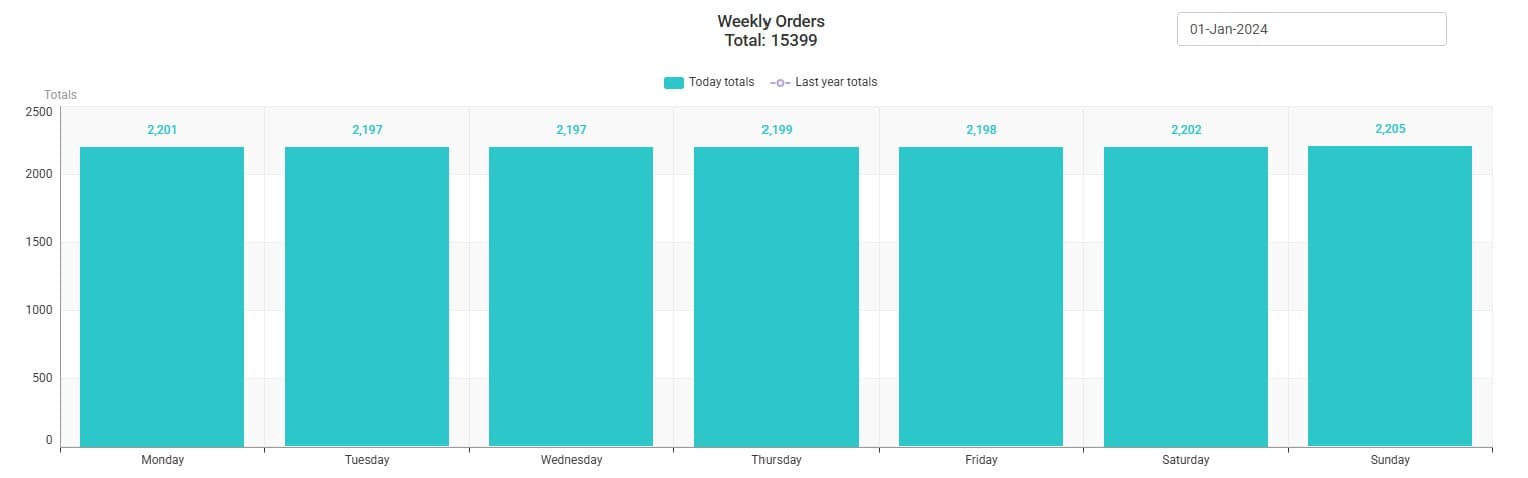
- Weekly orders (bar + line)
- Weekly sales (bar + line)
- Monthly orders (bar + line)
- Monthly sales (bar + line)
- Bars represent the selected period's totals (today / selected week/month). Lines represent the same period in the prior year for easy comparison.
Charts and axes
-
Weekly charts
- X axis: days of the week (Mon → Sun, or the locale-appropriate week ordering).
- Weekly orders Y axis: total order count (integer).
- Weekly sales Y axis: total sales value (currency).
-
Monthly charts
- X axis: months of the year (Jan → Dec).
- Monthly orders Y axis: total order count (integer) for each month.
- Monthly sales Y axis: total sales value (currency) for each month.
On every chart:
- Bars: current period totals (e.g., this week's daily totals, this month's monthly totals).
- Line: prior year's totals for the equivalent period (helps spot year-over-year differences at a glance).
Controls and filters
-
Weekly charts
- Date selector: pick any date within the week you want to inspect; the weekly charts will show the surrounding week containing that date.
-
Monthly charts
- Year selector: choose the year to display. The chart shows the 12 months for the selected year.
Notes:
- The weekly selector is date-based (you pick a date); the monthly selector is year-based (you pick a year).
- There is no table view or CSV export on this page — the focus is visual comparison (bars vs prior year line).
How to read the visuals
- Look for divergence between the bars (current period) and the line (prior year): a persistent gap indicates a sustained change in trading performance.
- For weekly views, peaks on specific weekdays commonly indicate campaign activity, promotions or operational events; use the date selector to focus the week for investigation.
- For monthly summaries, use the year selector to compare seasonal performance and spot long-term trends.
How is this guide?
Last updated on