Enrichment reports
Product enrichment dashboard showing missing data (images, prices, facets, merch pages) with export guidance.
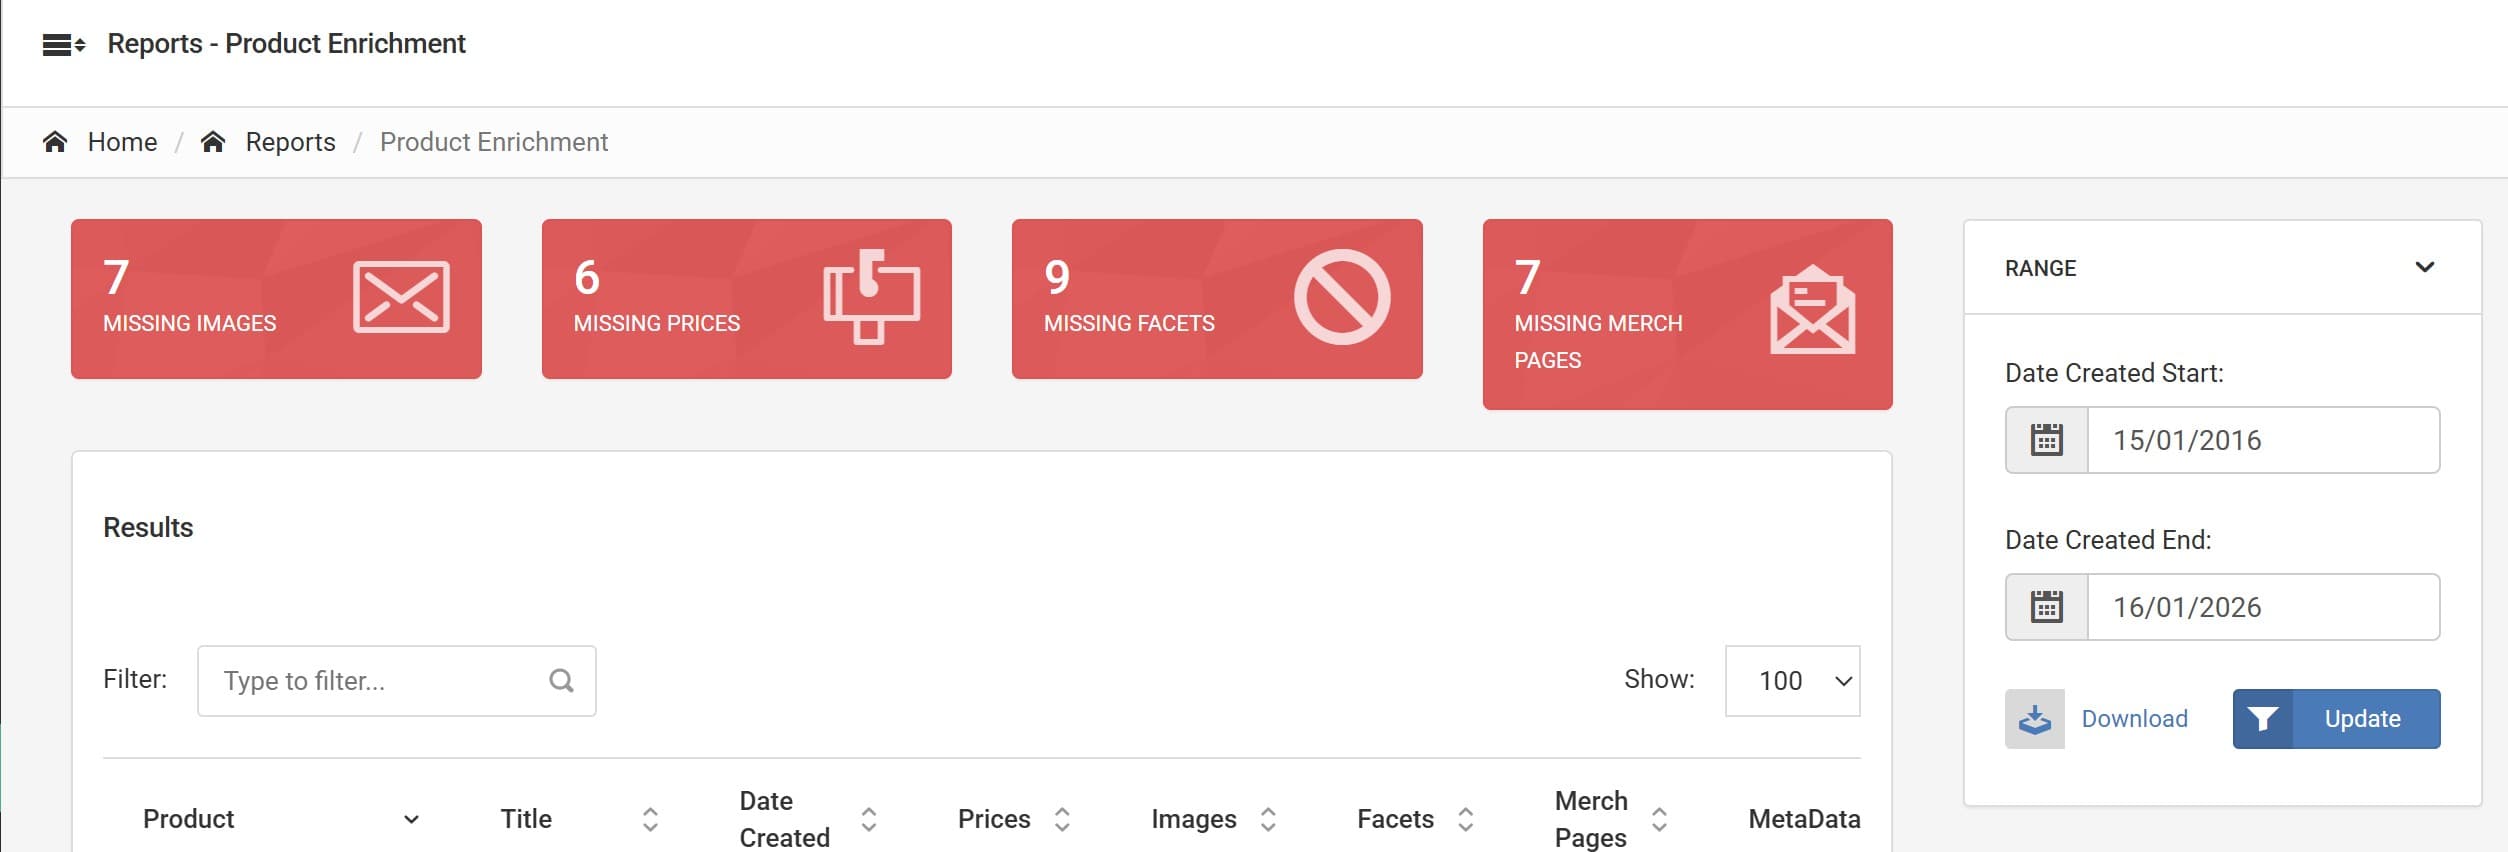
At a glance
- Purpose: surface products missing critical catalogue information (images, prices, facets, merch pages, meta) so teams can focus data enrichment work.
- Primary view: a table of products with counts for each data category and quick summary tiles showing totals of incomplete items.
- Controls: a date selector or snapshot selector (top of the page) and filters for brand/category to scope the review.
Quick summary
The top of the page has easy to read graphics to spot problem areas.
Table
The main view is a table of product rows with columns indicating how much data exists for each product. Typical columns shown:
- product_code — product or SKU code
- title — product title
- date_created — date the product was added to the catalogue
- prices — number of price records present (0 means missing)
- images — number of images present (0 means missing)
- facets — number of facet values present (0 means missing)
- merch_pages — number of merchandising/campaign pages or PDPs present (0 means missing)
- meta — number of SEO/meta fields present (0 means missing)
Rows with missing critical fields are visually highlighted (for example a red background) so you can quickly spot items needing attention. Non-zero columns indicate how many fields are populated.
CSV export
- Use the Download CSV action to export the current table (filtered by brand/category and snapshot). The CSV uses snake_case column names. Example row:
product_code,title,date_created,prices,images,facets,merch_pages,meta
SKU-000123,Example Product,2025-11-03,0,0,2,0,1
Exports are useful for handing to content teams or agency partners for bulk enrichment work.
Filters and controls
- Snapshot / date selector: choose a catalogue snapshot or date to view the enrichment state at that time.
- Search / product filter: narrow to specific SKUs, brands or categories.
- Quick summary tiles: top-of-page counters show totals of products missing images, prices, facets, merch_pages and meta.
How to interpret the data
- 0 in a column indicates missing content and should be prioritised for high-impact SKUs.
- Use the summary tiles to focus on the largest data gaps (for example many products missing images).
- Cross-reference with sales/top-seller reports to prioritise enrichment for high-value SKUs first.
Walkthrough: quick start
Select the catalogue snapshot or date you want to inspect.
Filter by brand, category or product list to focus content teams on a manageable set.
Sort or filter the table by columns with 0 values to find products missing the most fields.
Click Download → CSV to export the rows and assign enrichment tasks to content or agency teams.
Notes
- Highlighting: rows with critical missing fields are visually emphasised; check your theme/styling if colours differ.
- Use the export to create bulk upload sheets for images, prices or metadata updates.
How is this guide?
Last updated on