Daily Sales
Daily sales totals, order counts and quick guidance to interpret daily trends and export data.
This page explains how to read and use the Daily Sales report — quick metrics, chart behaviour, common filters and export tips.
At a glance
- Daily totals: the total revenue for the selected day.
- Order count: number of orders placed on that day.
- Trend comparison: previous year/day comparisons are shown alongside the selected date where available.
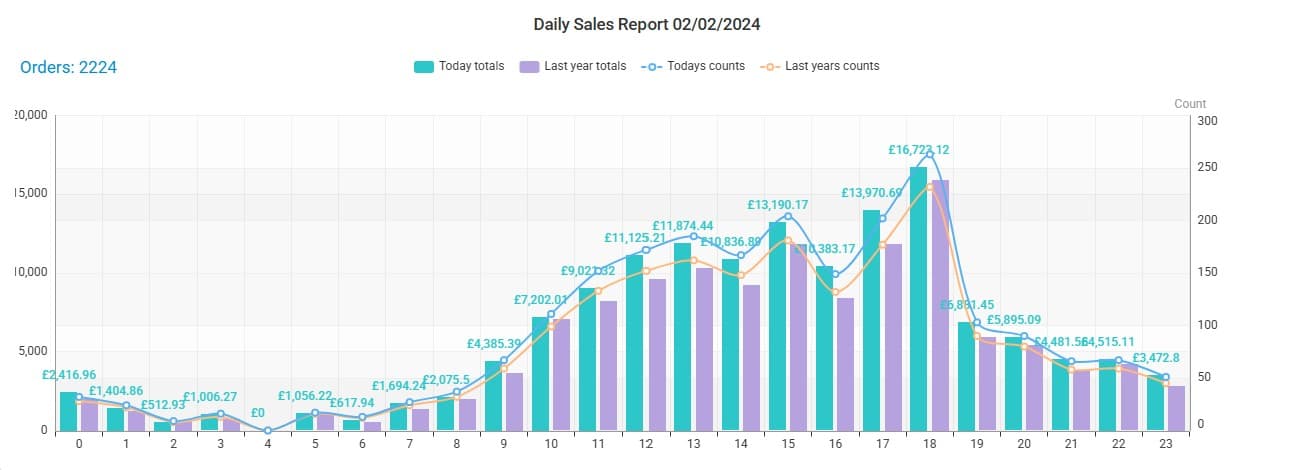
Chart overview
The main chart plots sales across the day. Typical behaviour:
- X axis: time (hours of the day) of the selected day.
- Primary series (bars): sales value for each time bucket.
- Secondary series (line): number of orders per bucket.
- Hovering a bar/point shows the exact value and order count for that interval.
Filters and controls
- Date selector: pick the day to view.
- Export: you can download the chart data or the underlying order table as CSV from the top-right menu.
Table below the chart
Under the chart there's a table listing orders that contribute to the day’s totals. Columns typically include order id, timestamp, value and status.
How to interpret the data (practical tips)
- Spikes in sales: check promotions, email sends or channel activity for matching timestamps.
- High order counts but low revenue: indicates many low-value orders — look at basket size or promotions.
- Persistent drop vs previous period: investigate site traffic, payment failures or checkout funnel issues.
Common use cases
- Quick health check: open the report each morning to confirm orders are processing and revenue is within expectations.
- Promotion monitoring: watch hourly results during campaigns to spot issues early.
- Fulfilment planning: identify peak dispatch hours to staff packing and carriers.
Notes
- Timezone: data is shown in the store timezone — check system settings if numbers look shifted.
- Sampling: very large datasets may be sampled in visualisations; exports contain the raw rows.
Walkthrough: get started quickly
Open the Daily Sales report and set the date to the day you want to inspect.
Use the channel filter to narrow to web or mobile if needed.
Hover the chart to inspect the exact order counts and values per hour.
Click Export → CSV to download the underlying order rows for further analysis.
How is this guide?
Last updated on