Best selling products
Product-level sales and top-seller listings with filtering and CSV export guidance.
This page documents the Best selling products report — chart behaviour, available filters, export columns and how to interpret the results.
At a glance
- Purpose: surface product-level performance over a selected date range so merchants can identify top sellers, revenue contributors and items needing replenishment.
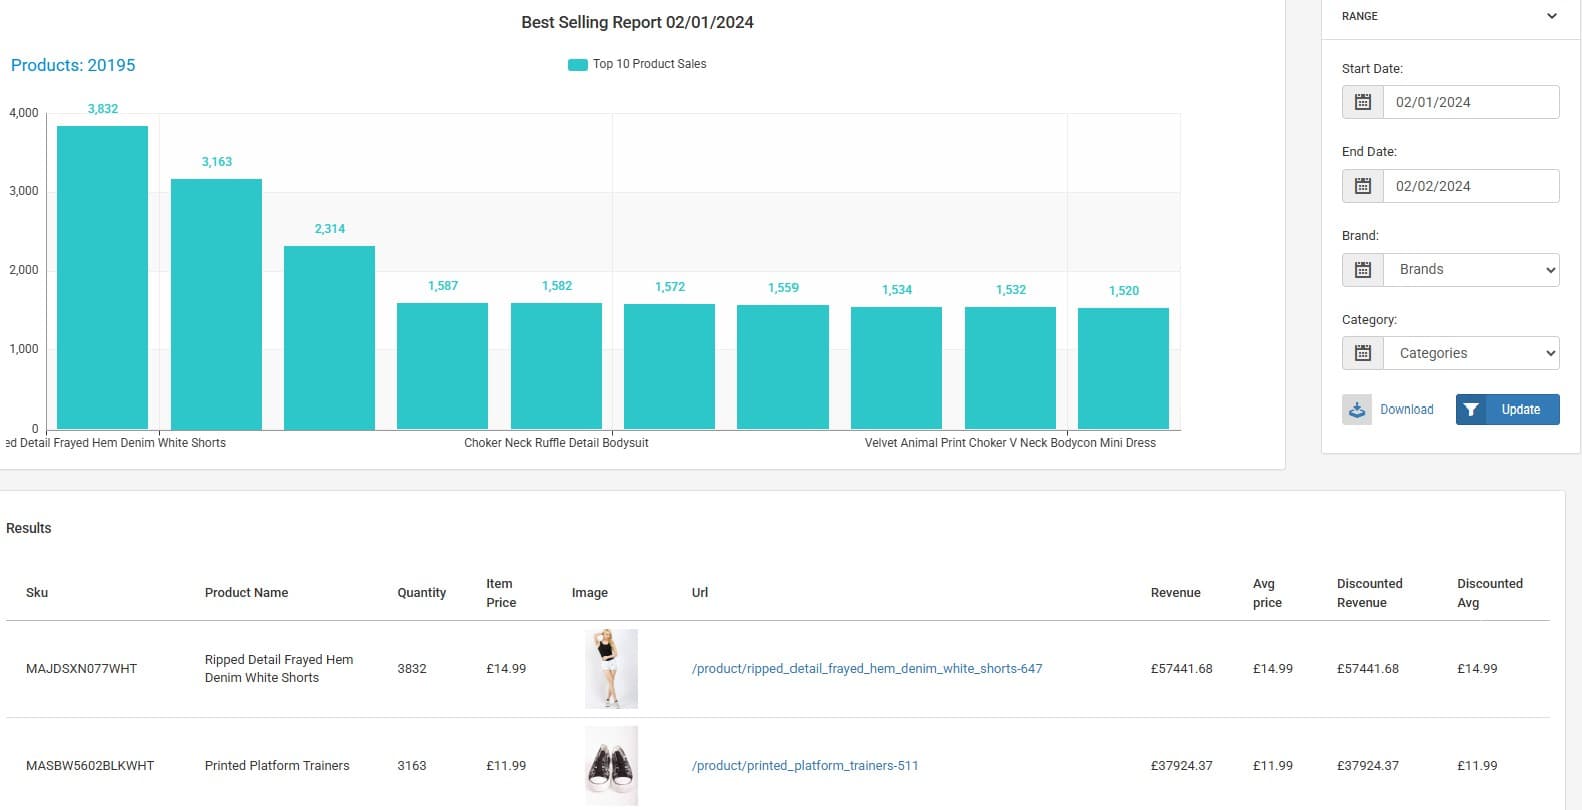
- Primary visuals: a ranked bar chart showing best-selling products and a table under the chart listing the same rows. A right-hand filter panel lets you narrow the range by date, brand and category.
Chart overview
- Visual: horizontal or vertical bars representing product performance (commonly quantity sold or revenue). The Y axis (or horizontal measure for a horizontal bar chart) shows the metric (quantity or revenue) and the X axis lists product names.
- Behaviour: where product names are long they can be viewed on hover or via the table; bars are ordered by the chosen metric so the top sellers are shown first.
Typical metrics available:
- Quantity: number of units sold in the selected range (useful for operational stock decisions).
- Revenue: total sales value attributable to the SKU in the selected range (useful for profitability and merchandising).
Filters and controls
- Date range selector: pick the period you want to analyse (from / to).
- Brand filter: restrict the view to a single brand or multiple selected brands.
- Category filter: focus the chart and table on one or more product categories.
Table and export
- Under the chart there is a table listing the products in rank order (same rows as the chart). Typical columns exported in CSV:
sku,product_name,quantity,item_price,image_url,product_url,revenue
SKU-000123,Example Product,120,25.00,https://.../img.jpg,https://.../product/sku-000123,3000.00- The CSV includes one row per product with SKU, product name, quantity sold, item price (unit price), an image URL, the product URL and total revenue for the product over the selected range.
How to interpret the report
- High quantity, low revenue: many low-price sales — check margins and whether the SKU should be prioritised for promotions or bundling.
- High revenue, low quantity: a few high-value items driving revenue — ensure availability and prioritise merchandising.
- Rapid changes in rank: sudden rank shifts often follow promotions, catalogue updates, or pricing changes; cross-check promotion logs and price edits.
Walkthrough: quick start
Select the date range you want to analyse.
Use the Brand / Category filters to narrow to the assortment you care about.
Click Export → CSV to download the table rows for offline analysis.
How is this guide?
Last updated on