Dashboard
Your organisation-wide home page across every monitor, with four tabs covering metrics, prompts, responses, and citations.
The Dashboard is your organisation-wide home page. It has a date range selector (defaults to the last 7 days) and four tabs.
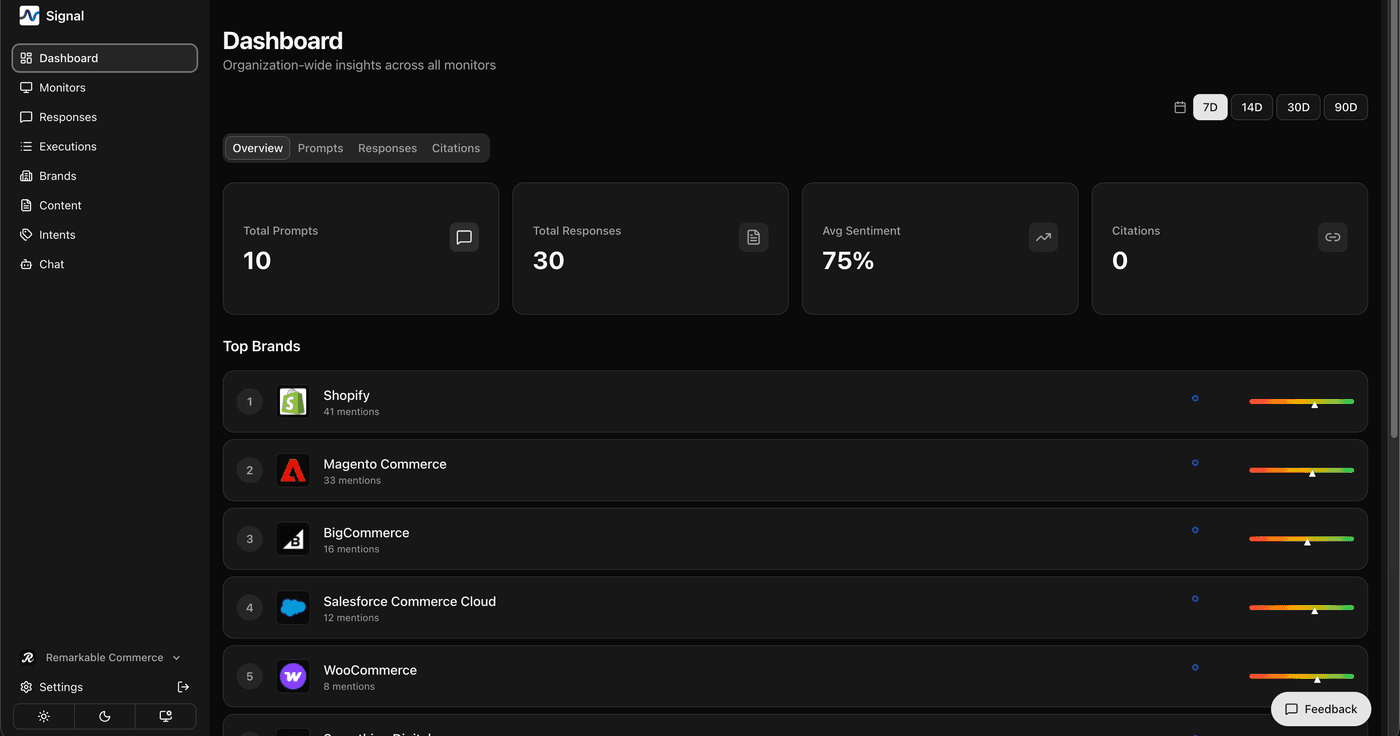
The headline view of how your brand is performing across every monitor.
- Metric cards: Total Prompts, Total Responses, Average Sentiment, and Citations
- Top Brands: the brands mentioned most often, each with a sparkline trend
- Quick Links: one-click access to Monitors, Responses, Executions, and Brands
A searchable, filterable table of every prompt across your organisation, showing:
- Sentiment
- Response volume
- Brands mentioned
- Intent category
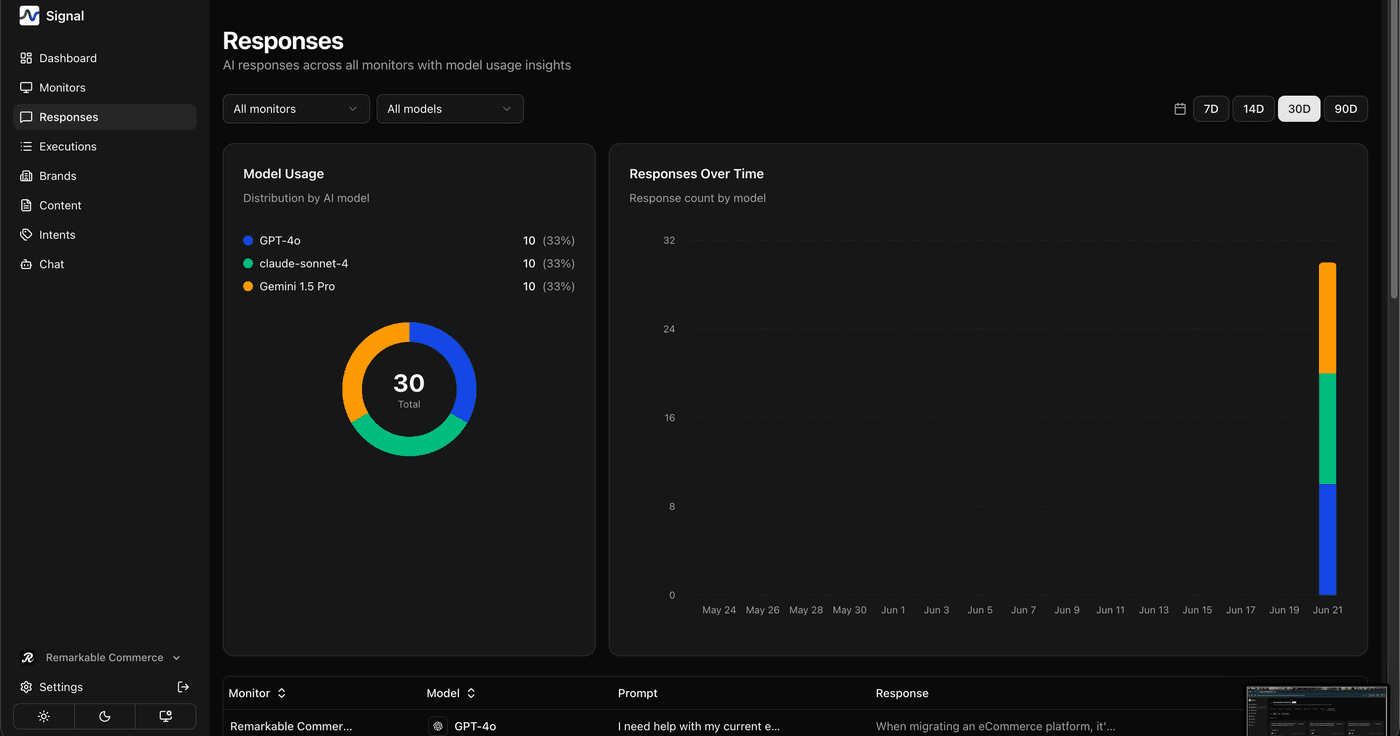
A scrollable feed of individual AI responses for the selected date range, plus a model-usage breakdown and a responses-over-time chart.
Shows which external sources and domains are most frequently cited by AI models, broken down by brand.
Use the date range selector in the top corner to widen or narrow every tab at once — handy for comparing this week against last.
How is this guide?
Last updated on